“In the early 1900s, scientists found that a liquid or solid heated to high temperatures would give off a broad range of colours of light. However, a gas heated to similar temperatures would emit light only at certain specific colours (wavelengths). The reason for this observation was not understood at the time.” [1]
I’ve wondered if this principle could extend to pigments in artistic works – while the process of generating light is different, various colors have gone in and out of fashion over time. Modern fabric dyes hold vivid, even lurid colors, whereas some pigments have fallen in popularity due to toxicity (lead, cadmium) or cheaper replacements, E.g. lapis lazuli as the basis for ultramarine blue in Renaissance painting. If you could identify the presence of specific pigments from a photograph, it might provide a crude filtering mechanism for images to help find images from a particular time period, locale, artist, or medium.

To test this theory, I built a small visualization using D3.js to test it out. To simplify the example here, I’m going to show only the RGB colorspace, so you can see how it works. Since this is the natural realm of HTML, it simplifies the code, but it’s a terrible color space for looking at real works of art.

I used several images in testing, of stained glass and shibori (a Japanese version of tye-die, which often involves muted earth tones). Stained glass windows are difficult to photograph, and large patches of most images are over or under-exposed. Looking at histograms in the HSV colorspace (hue-saturation-value) shows this, the value and saturation filters show large spikes at either end.
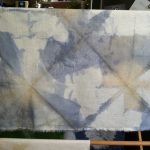
For shibori, I had no such issues; the images have an added benefit, in that I know what dyes are used. After looking at histograms for a while, I remembered a key difference between these mediums: fabric dyeing is mostly additive process, with the amount of color determined by how long the fabric soaks. Stained glass (and any fired ceramic) can have different hues based on how it’s fired, and combines glass colors with several layers of different types of paints, stains, and glazes.
In future research, I’m intending to build histograms that support drilling down (similar to a data-warehousing feature). I found a library from Square that purports to do this in Javascript.
I also suspect the use of other color-spaces would be valuable. For modern print media, CMYK might make sense, or even guessing Pantone colors from an image (although this may fail due to bias in photographing the piece). Color systems designed by painters (e.g. the Ostwald System) seem promising as well.
D3.js is a Javascript library for building data driven documents, commonly used to build interactive infographics (see the New York Times and ProPublica for examples). I was aiming for an interactive animation of various histograms; it took a while to figure out how to get the animation working.
The library has a nice functional style, which makes for clean code but, like much lisp code, fails to use syntax to call out important grammatical points in code. Each statement is a sequence of successive transformations of data / html / svg objects, and you need to figure out when to start new transformations. The animations also happen in a background thread, so you need to hook into the end of each to trigger the next. If you tell D3 to transform an object’s attributes from one value to another, it does a nice job, except for some rendering glitches with rounding.
function update(data, duration, delay, c)
{
  var hist = d3.select("body").selectAll("div");
  var hist = hist.data(data);

  function color(d) {
    if (c === 'r')
    return 'rgb(' + Math.round(d.x + d.dx / 2) + ',0,0)';
    if (c === 'g')
    return 'rgb(0,' + Math.round(d.x + d.dx / 2) + ',0)';
    if (c === 'b')
    return 'rgb(0,0,' + Math.round(d.x + d.dx / 2) + ')';
  }

  var index = 0;
  hist.transition()
      .delay(delay)
      .duration(duration)
      .style("height", function(d) {
        return Math.floor(200 - y(d.y)) + "px";
      })
      .style("background-color", color)
      .each("end", function(i){
        if (index === 0) {
          // trigger next animation here
        }
        index++;
      });

  hist
    .enter()
    .append("div")
    .style("height", function(d) {
      return Math.floor(200 - y(d.y)) + "px";
    })
    .attr("class", "bar")
    .style("background-color", color);
}